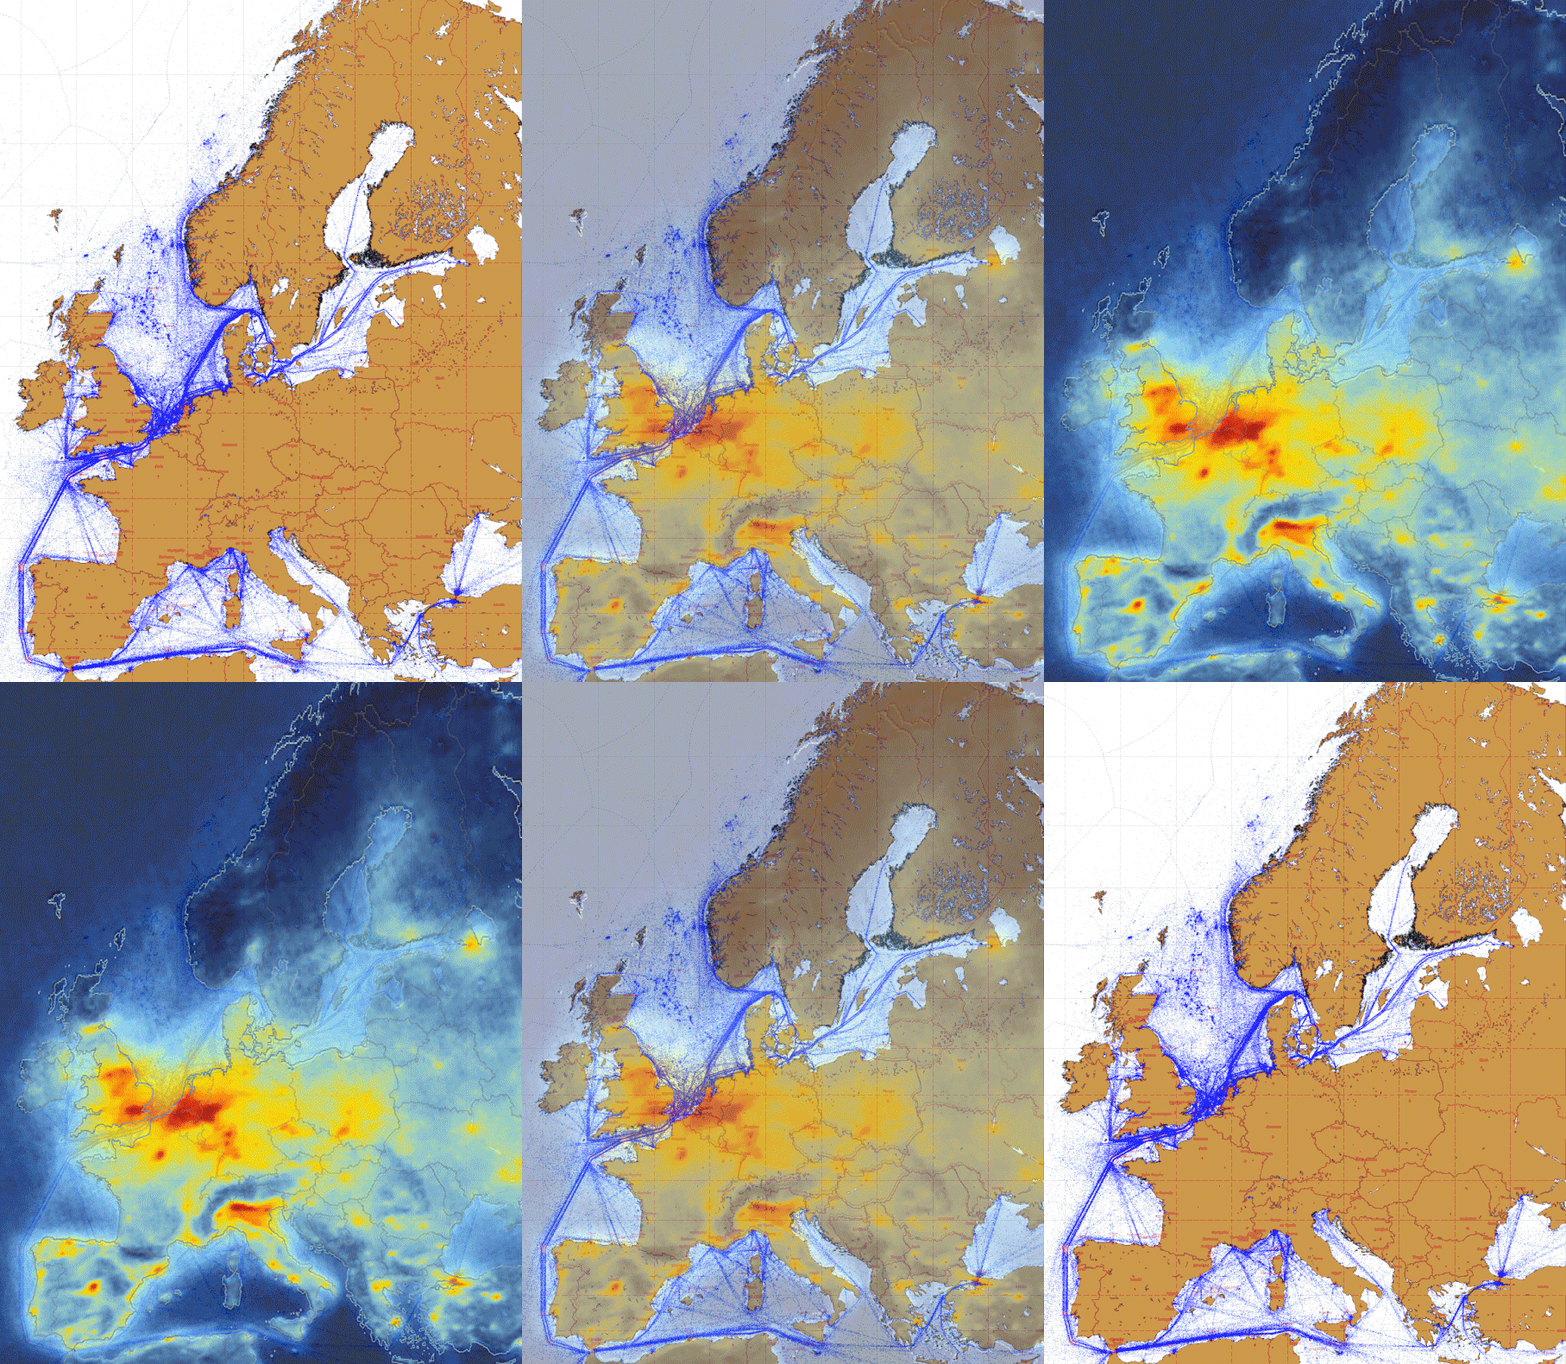
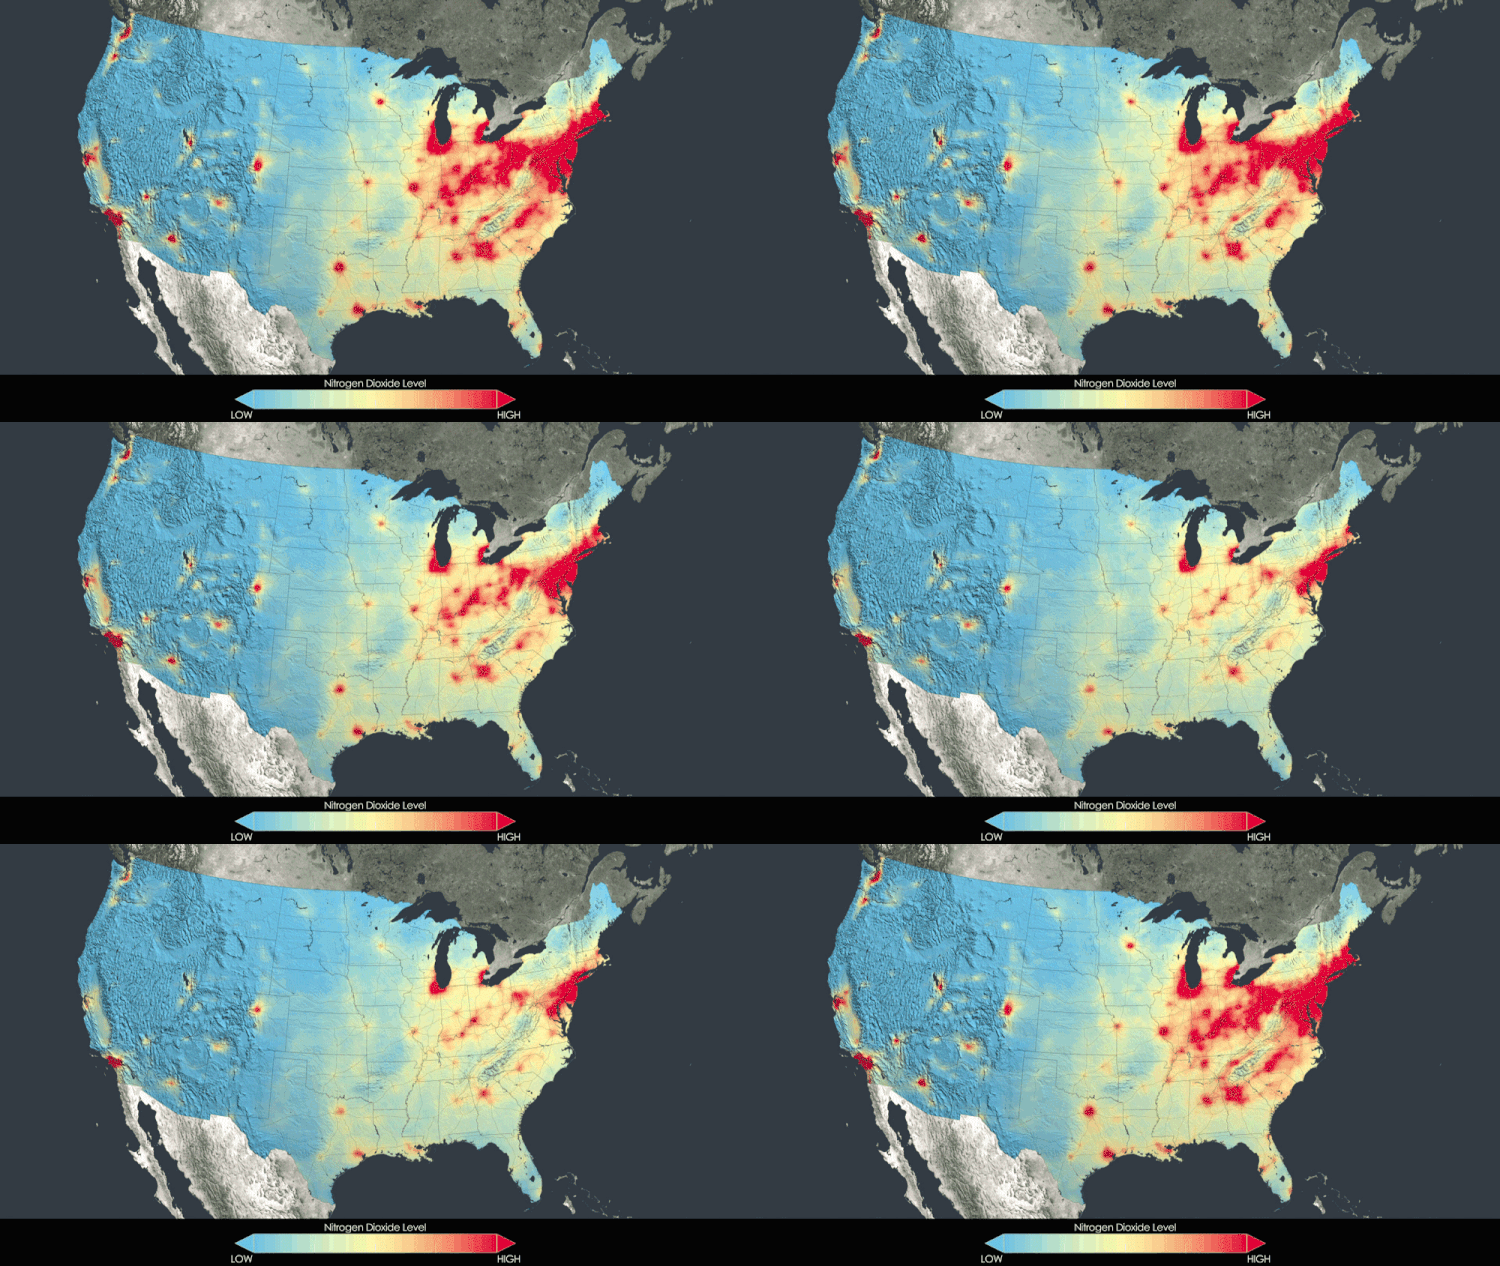
Particulate matter – also referred to as aerosols or air pollution – are microscopic particles present in Earth’s atmosphere. Some occur naturally, during wildfires and volcanic eruptions, and some are the result of human activities, such as car exhausts and powerplants, formed from the chemical reactions of gases such as sulphur dioxide (SO2) and nitrogen oxides (NOx: nitric oxide (NO) and nitrogen dioxide (NO2)). Measures to reduce the emissions of these precursor gases are therefore often beneficial in reducing overall levels of particulate matters or air pollution.
Particulate matter is especially important to monitor because of its impacts on climate, as well as its adverse effects on human health, having been linked to asthma, lung cancer, prenatal complications, and a number of respiratory diseases.
Looking at pollution from space
Air pollution is often hard to see from the ground so it can come as a surprise that it is quite visible from space.
The Ozone Monitoring Instrument (OMI), aboard the NASA Aura satellite, provides measurements of NO2, one of the precursor gases responsible for particulate matter pollution. Additionally, most of the NO2 captured by the OMI satellite instrument is right near the surface. As a result, patterns in the NO2 data can strongly reflects what is happening at the surface in terms of emissions. This explains why OMI is one of the most widely used instruments for researchers looking at air pollution from space.
For example, thanks to data from OMI, highways and ships pathways are very visible from space. “As the problems of pirates off the coast of Somalia became more pronounced in 2009 relative to 2004, researchers at the University of Bremen pointed out that that the pollution tracks from ships moved further and further out to sea as they started to go further away from the coast to avoid pirates”, recalled Daven Henze, associate professor of mechanical engineering at the University of Colorado Boulder, US.
Other applications of NO2 measurements include monitoring cities emissions, to assess socio-economic activity – a strong wealth marker – and identify causes of daily or weekly variations in output. For example, the country’s predominant religion could explain drops in emissions on a certain day.
Scientists have also been looking at global trends and estimates for emissions of NOx – the nitrogen oxides most relevant for air pollution, NO and NO2– comparing results with the state’s pollution reduction goals, trying to understand the impact of emissions control policies overtime.

Building models for pollution to find better mitigation strategy and improve human health and climate
Most models for aerosols – or particulate matter – distribution are built for the global scale – with spatial resolution spawning several hundreds of kilometers, making it difficult to assess exposure at the city level. This is why Henze and his team are working on improving the models’ precision – down to 10 km – for the UN Climate and Clean Air Coalition (CCAC).
According to Henze, “If you used global model resolution – 200-300 km scale models –, to try and estimate aerosols exposure, you can incur an error of up to 30-40% because the spatial scale is so different than the spatial scales of gradients in population densities”, i.e. the scales of transitions from urban to rural areas. “
This is the reason why, in 2015, Henze decided to increase the accuracy of the global distribution model by incorporating satellite data identifying population concentrations, correcting the aerosols concentrations to more closely match where humans are present – adjusting, for example, for urban and rural areas.
The new model, developed in collaboration with Randall Martin’s group in Dalhousie, was built using a particulate matter concentration model derived from data collected by MODIS, MISR, SeaWIFS, and Calypso satellite instruments that estimate surface fine particulate air pollution – or PM2.5 – at high resolution.
Using this new combined model to calculate exposure at a much finer resolution than the coarse global simulations, the team built a tool kit for the United Nations Climate and Clean Air Coalition (CCAC) that estimates relationships between pollutants exposures and emissions, called LEAP-IBC.
The toolkit is offered to member nations trying to get funding from the UN for pollution reduction policies. Not all countries have the resources to do detailed modeling, and air pollution health impact analysis. But now, countries can use open satellite data with this kit to gauge the impact specific mitigation strategies, such as powerplant emissions reductions, would have on human health and climate.

Saving the world, one satellite at a time
The World Health Organization (WHO) estimates that “fine particulate air pollution – or PM2.5 –, causes about 3% of mortality from cardiopulmonary disease, about 5% of mortality from cancer of the trachea, bronchus, and lung, and about 1% of mortality from acute respiratory infections in children under 5 years, worldwide.”
As satellite sensors continue to improve and the number of satellites increases, toolkits, such as the one developed by Henze and Martin, will only become more precise, offering countries the ability to monitor on a daily, or even hourly, basis the efficiency of their mitigating strategies.
Using satellite data to find new ways to reduce pollution exposure could help save millions of lives every year.
—
Interested in using this data, simply visit the SEDAC website.


