Colors are just how our eyes interpret light. Light is made of electromagnetic waves. When light shines on an object, some wavelengths are absorbed and others are reflected.
The colors we’re able to see are just a small range of reflected wavelengths that can be perceived by our vision. They consist of a tiny visible portion of the electromagnetic spectrum.

What about the other wavelengths that we can’t see, such as ultraviolet and infrared?
Satellites can be equipped with sophisticated sensors that can detect these wavelengths. Then, remote sensing professionals can assign these bands to colors we’re able to see, allowing us to interpret the information. As a result, a satellite image can depict landscapes in colors that seem a bit weird to the average person.
In this blog, you’ll learn more about the most common satellite visual outputs and their applications.
True Color Image
A true color image is the combination of the red, green, and blue bands.

The result is an image that looks like how our eyes perceive the world and its colors. For that reason, true color is the preferred image output for visual inspections.
False Color Infrared
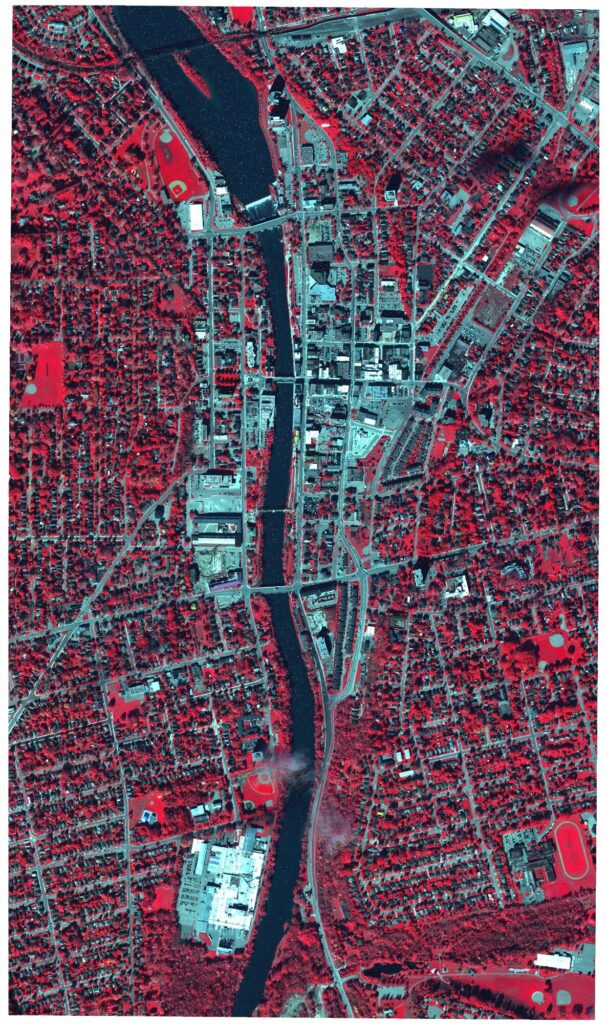
The main benefit of a false color image is that it allows us to visualize wavelengths that the human eye can’t see. Seeing these wavelengths translated into colors can help geospatial experts analyze the data collected by satellites and distinguish features.

With False Color Infrared, the image is a combination of near-infrared, red, and green bands. Typically, vegetation looks bright red, buildings are represented by different shades of brown, and water is very black, unless it is full of sediment—in that case, because the sediment reflects visible light, it will appear blue.
This image output is really good at delineating features and monitoring floods. It can also be used to distinguish water from snow and ice.
False Color Urban
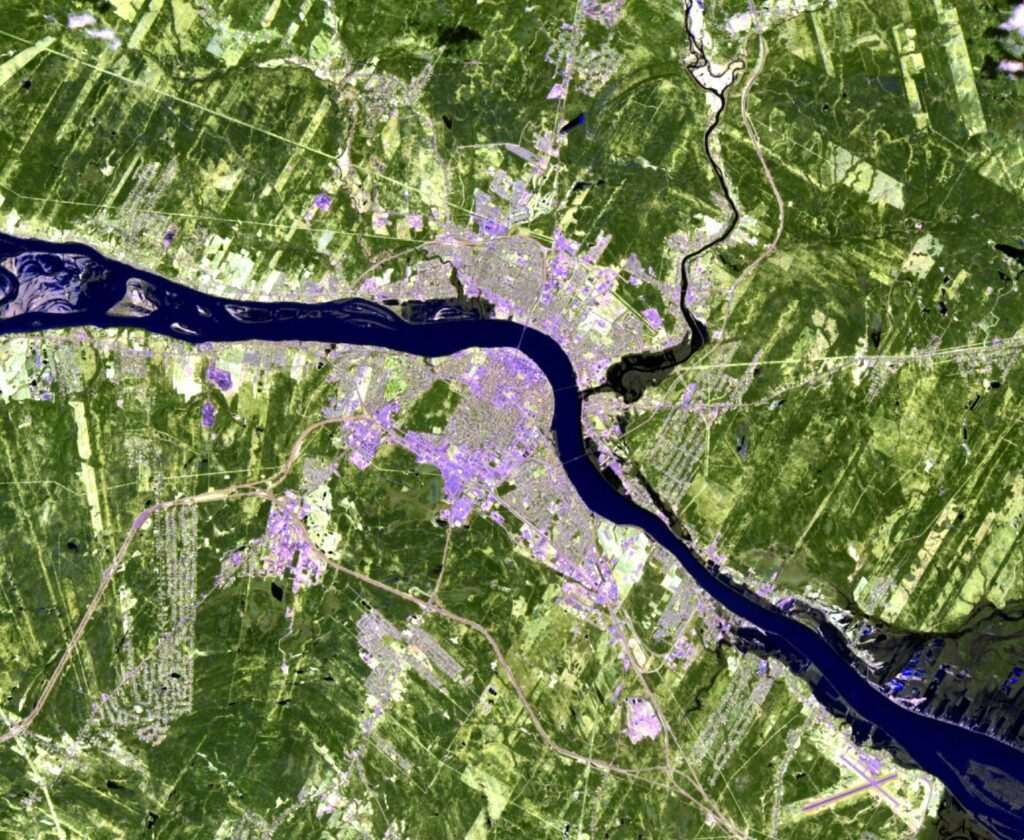
A false colour urban composite image is a combination of short wave infrared 1 (SWIR1), short wave infrared 2 (SWIR2), and red bands. It is often used to track urban sprawl and identify areas at risk of flooding.

Using SkyWatch’s EarthCache, you can obtain False Color Urban images captured by Sentinel-2 with a resolution of 10m.
NDVI
NDVI stands for Normalized Difference Vegetation Index and it has several applications in the agriculture and forestry industries. It can be used to measure biomass, assess plant health, track vegetation growth, and monitor drought.

Basically, the idea here is to measure how strongly the plant reflects near-infrared light. Dry, sick, and unhealthy vegetation tends to absorb more near-infrared light rather than reflecting it, so NDVI images can depict that.
MSAVI2
This type of image composite is mostly used in agriculture and MSAVI2 stands for Modified Soil Adjusted Vegetation Index. Remote Sensing Managers can look at these images to analyze vegetation cover, biomass, and leaf area index.

MSAVI2 is also commonly used for mapping land cover and vegetation classes. For example, a GIS Manager should be able to study the image to determine if it portrays a forest, a grassland, or a desert.
Like NDVI, MSAVI2 represents vegetation greenness with values ranging from -1 to +1 while correcting for the influence of soil brightness when vegetative cover is low.
NDWI2
NDWI2 is the Normalized Difference Water Index, which is very useful for monitoring vegetation in areas affected by drought. It combines reflectance of near infra-red and shortwave infrared wavelengths to enhance the water information obtained from other image composites.

This image output is also great for analyzing water bodies. Typically, water appears blue in these images, but the shades of blue will change depending on how clear or turbid the water is.
EVI
EVI stands for Enhanced Vegetation Index.

It is most commonly used for measuring canopy coverage and crop health, especially in the late season.
Near-Infrared (NIR)
As the name suggests, this satellite image output will capture only near-infrared wavelengths, which are just outside the visible spectrum at the red end. Keep in mind that near-infrared is not visible to the human eye, but a satellite equipped with NIR sensors can see it.

According to this interesting article published by ArcGIS, the most common way to visually represent near-infrared reflectance on images is to have it show as red. The actual red band is shown as green, the green band is shown as blue, and the blue band is left out.
Near-infrared is often used for studying vegetation type, density, water content, and plant health. Remote sensing managers may prefer to use indexes such as NDVI to visualize the information more easily.
Panchromatic
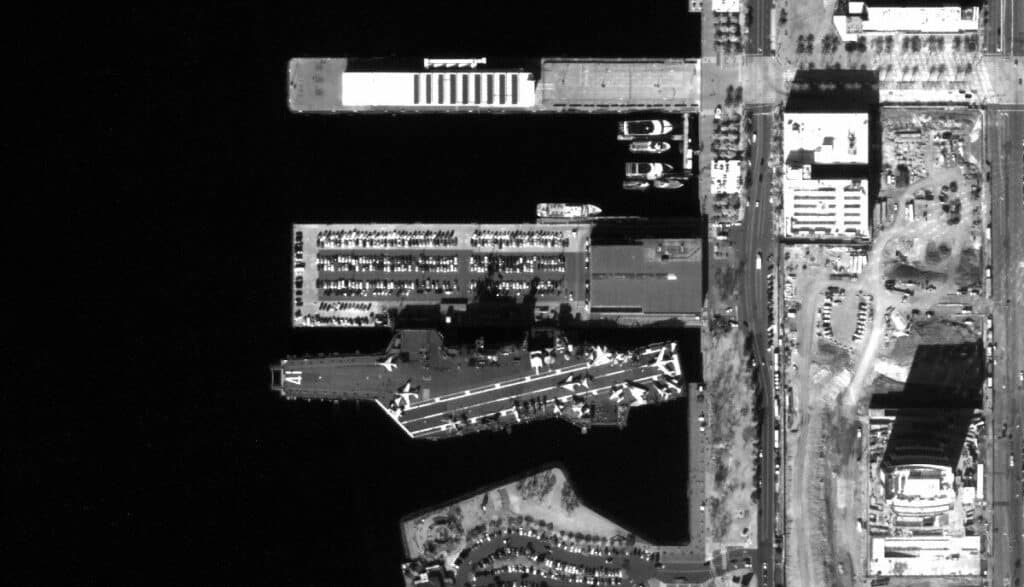
Some satellites, such as Landsat and SPOT 6/7, can blend information from the RGB bands into a single band that is called panchromatic. This information is typically visualized in a grayscale image. Each pixel represents the intensity of the solar radiation reflected by objects in the area captured by the satellite.

SkyWatch’s EarthCache can pansharpen the multispectral bands while keeping the detail of the panchromatic band. The pan band on its own may be useful to simplify detection by only needing one band at full resolution.
SAR
SAR stands for Synthetic Aperture Radar and it offers a completely different way to view the Earth. According to NASA, this type of data collection involves a sensor that produces its own energy, shoots it at the Earth, and then records the amount of energy reflected back from the planet.
While multispectral satellite images can collect data in the visible, near-infrared, and short-wave infrared portions of the electromagnetic spectrum, SAR utilizes longer wavelengths. The main benefit of that is the ability to see through clouds and the ability to acquire images during the day or night.
SAR images are colorized by the wave polarizations. Polarization refers to the direction of travel of an electromagnetic wave, which is the signal sent from the satellite.

SAR systems can gather detailed information on the polarimetric properties of the observed surface, which can reveal the structure, orientation, and environmental conditions of the surface elements.
From this, images can be falsely coloured to represent vegetation, buildings, and bare areas. SAR applications include agricultural classification, forest mapping, flood mapping and change detection.
Buying Satellite Images With EarthCache
SkyWatch is a Waterloo-based company on a mission to make Earth observation data accessible to everyone. We connect remote sensing managers and developers with one of the largest networks of satellite imagery providers in the world.
Our talented team built EarthCache to simplify the process of buying commercial satellite images. Once you sign up, you’ll have access to multiple data providers, such as Planet and Airbus, all under one roof. It’s like Amazon for satellite imagery!
EarthCache is extremely easy to use, so you don’t have to worry about complicated data agreements and lengthy negotiations. It’s also risk-free because there are no subscription fees, you only pay for what you buy and when the images are delivered.
If you’re building an application, you’ll get instant access to the EarthCache API. You’ll be able to create your prototype at no cost with open data sources.
To request access to EarthCache, fill out the form below. We’ll get in touch with you to assess your needs, give you a product tour, and create your account.


