What data do you need?
Deciding that satellite imagery is the right solution for your organization is a great first step to getting insightful data at your fingertips. But if you’re new to these solutions, there are some basics you need to know. We at SkyWatch understand the difficulty of navigating the world of Earth observation (EO) data. It’s technical, has a unique vocabulary, and until 2018, was very difficult to get a hold of.
The Ultimate Satellite Imagery Guide is here to help you understand what data you really need to capture images. We’ll walk you through the basic terminology and things to consider when choosing a satellite imagery provider.
The Process of Tasking Satellite Imagery
Tasking is a technical term. It’s how you ask the satellites to capture an image over your area of interest (AOI) and tell it what technique to use. Depending on your provider, this process will look different; but we make it pretty simple at SkyWatch.
Firstly, you’ll want to review the type of commitment or contract requirements on the provider’s platform to order your images. Many providers ask for a minimum spend, which can be daunting.
Tasking vs. Archive
You will task the satellite if you’re looking for a new image that hasn’t been taken before. If you need imagery of a particular area that has already been captured, you can find it in the Archive Search on our platform.
After activating your free account on our EarthCache platform, create a “pipeline” to order your images.
A pipeline includes your area of interest (AOI), image output, resolution, and the date range to get your results. The options are endless for the types of satellite imagery you can find, and having no minimum contract spend offers maximum flexibility.
AOI
As listed above, an AOI is the area of interest you want an image to cover. There are three ways to select your AOI when tasking satellite imagery on the EarthCache platform.
- Use GPS coordinates or type in the name of a city or location in the console.
- Manually draw the AOI using the polygon tool.
- Upload a KML or GeoJSON file.
If the KML/GeoJSON file sounds technical, it’s because it is! KML or Keyhole Markup Language is a file format that displays geographic data in an Earth browser, such as Google Earth. You can create KML files to pinpoint locations, add image overlays, and expose rich data in new ways. Equally, GeoJSON is an open standard geospatial data interchange format representing simple geographic features and nonspatial attributes. Based on JavaScript Object Notation (JSON), GeoJSON is a format for encoding various geographic data structures.
The next item is image output.
Image output
In short, the image output is about deciding the color or band combinations and indices you want to receive. Each option highlights different details in your imagery to deliver valuable insights about your AOI.
Multispectral Outputs
Multispectral outputs are made up of bands within the multispectral spectral ranges.
This includes:
True Color
A true color image combines the red, green, and blue bands. It’s a close representation of what humans see in real life. True color is a good baseline if you’re unsure which image output is best for your project.

False Color Urban
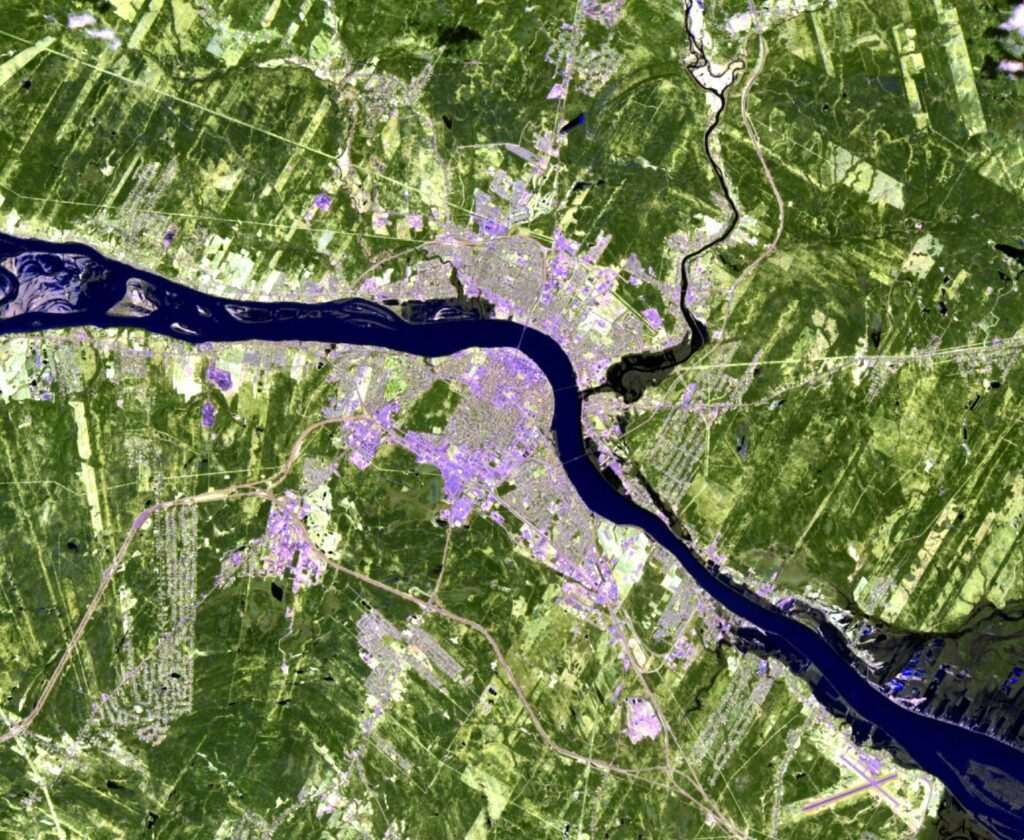
A false color urban composite image combines shortwave infrared 1 (SWIR1), shortwave infrared 2 (SWIR2), and red bands. False color images have wavelengths that we can’t see with the human eye. An example use case for the False Color Urban output is tracking urban sprawl and identifying areas at risk of flooding.
False Color Infrared
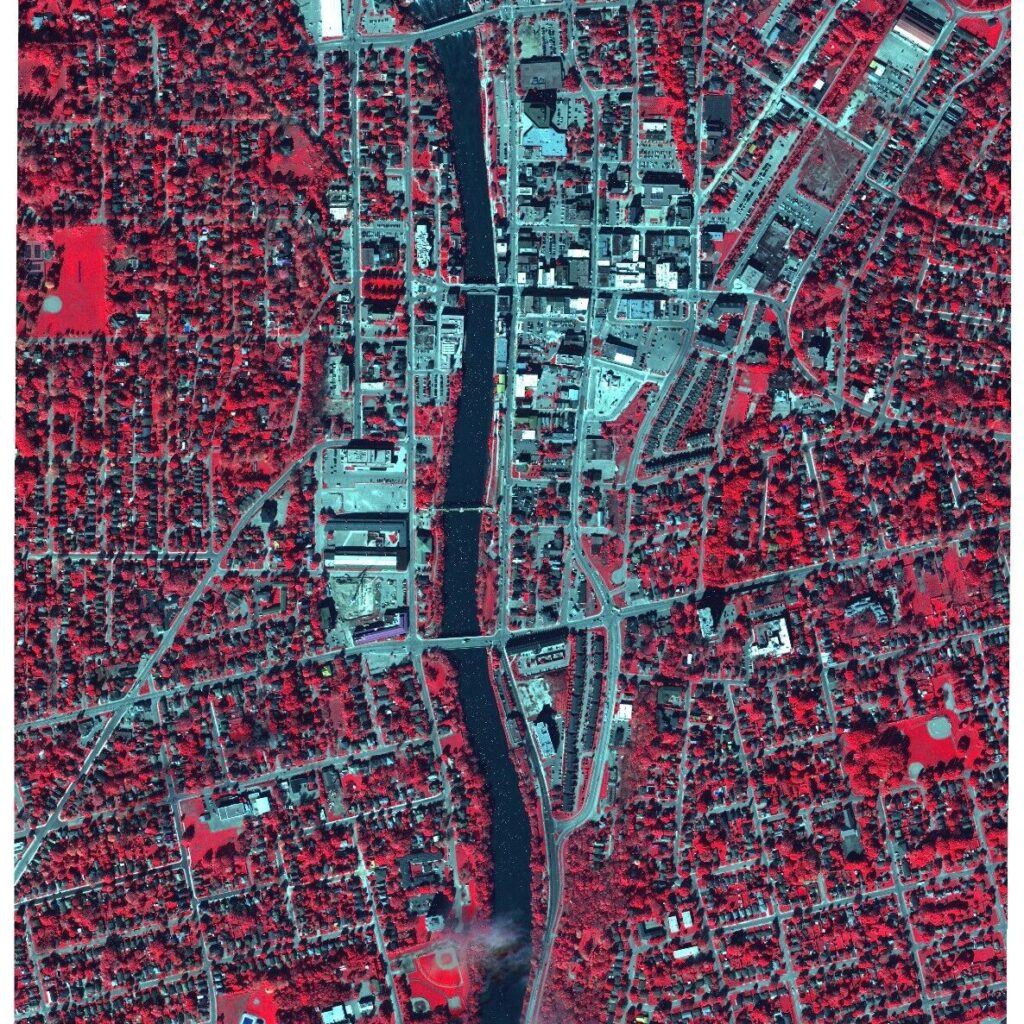
A False Color Infrared image combines near-infrared, red, and green bands. Geospatial experts use this imagery to distinguish detailed features, such as buildings, water, vegetation, snow, ice etc. As you can see, vegetation is especially highlighted in this type of output.
All Optical Bands
A file containing all bands captured by the sensor. This includes red, green, blue and near infrared, along with panchromatic and additional bands (when available from the sensor).
To learn more details about multispectral outputs, read our article on satellite imagery outputs and their applications.
The multispectral outputs can capture details differentiated by color, but if you need even higher amounts of detail to identify or classify objects, that’s where indices come in.
Indices
Indices are calculated using the multispectral bands. These calculations result in the outputs being in the form of an index with values between 0-1. At the same time, the indices provide additional information about the ground surface being imaged.
Normalized Difference Vegetation Index (NDVI)
NDVI is used to quantify vegetation greenness. Above all, it is useful in understanding vegetation density and assessing changes in plant health.

Second Modified Soil Adjusted Vegetation Index (MSAVI2)
MSAVI2 is a radiometric index using the near-infrared and red bands. Its outputs are often used to monitor vegetation cover, biomass, and leaf area index. They can also be used as an input layer for mapping land cover or vegetation classes.

Enhanced Vegetation Index (EVI)
EVI is similar to Normalized Difference Vegetation Index (NDVI) and can be used to quantify vegetation greenness. However, EVI corrects for some atmospheric conditions and canopy background noise. It is also more sensitive in areas with dense vegetation.
Normalized Difference Water Index (NDWI2)
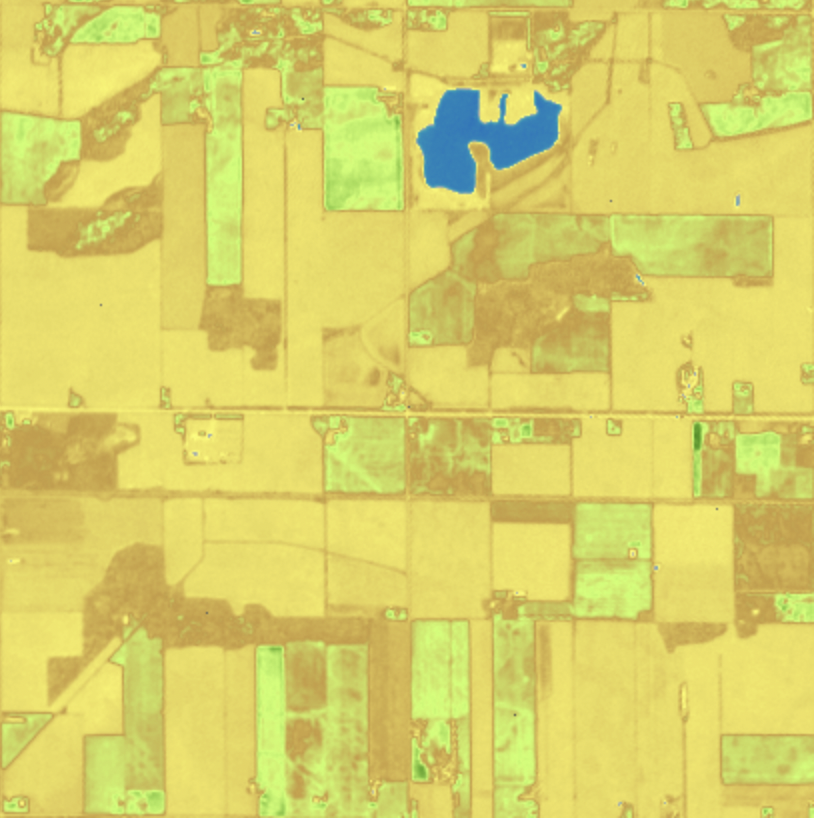
NDWI2 is a normalized index of the water content in an image. The output NDWI2 can be interpreted similarly to NDVI: the closer to a pixel value of 1, the more likely the pixel is to be water, or water-saturated. NDWI2 is calculated by a ratio of the near infrared band and shortwave infrared bands.

Resolution Requirements
Choosing the right resolution is an important step in tasking satellite imagery. Here are two ways to think about resolution:
Spectral Resolution
This resolution type relates back to the output bands of a sensor. Satellite sensors collect information on various light spectrum bands, which are then relayed back to us in a different format than regular photos. Basically, the spectral resolution of a sensor defines the number of different bands that sensors collect. Each with unique characteristics that may be relevant to different customer use cases.
Some examples may include:
Panchromatic (480 – 830nm)
Blue (430-550nm)
Green (490-610nm)
Red (600-720nm)
Near Infrared (750-950nm)
Spatial Resolution
Spatial resolution can be defined as the amount of data a single image pixel represents on the ground. A 50cm spatial resolution product has 1 pixel representing a 50cm km2 area on earth. A 10m spatial resolution product has 1 pixel representing a 10m km2 area on earth.
In our product, EarthCache, we define low, medium and high resolutions by these measurements.
High Resolution (50cm-1m)
Medium Resolution (1.5-8 m)
Low Resolution (8-15 m)
The following chart includes an overview of each available product under our suppliers’ offerings.
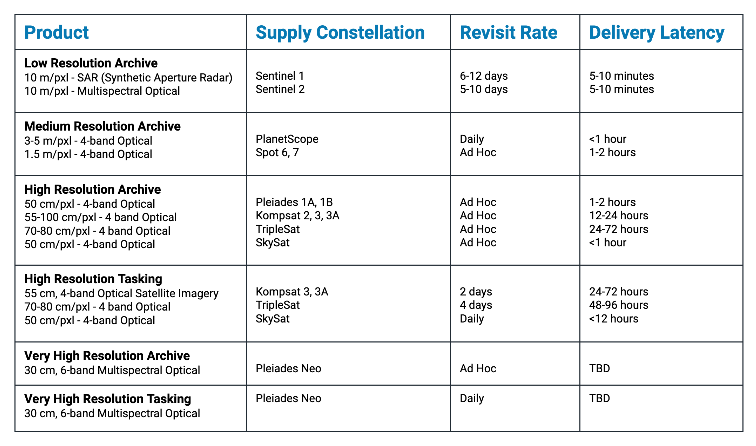
Latency
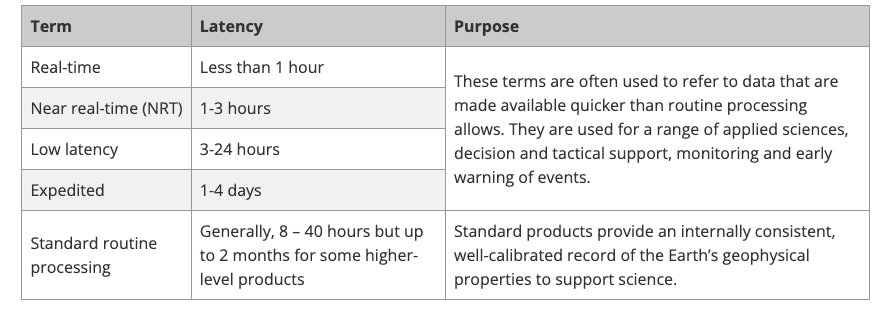
For satellite data, data latency refers to the time between satellite observation and the time data is available to users. Earth science data providers use different terminology to describe data latency. Near-real-time (NRT), low latency, and expedited are often used interchangeably to refer to data made available more quickly than routine processing allows.
As a result, understanding resolution will help you pick the correct type of imagery and set realistic expectations regarding timelines in your project.
Frequency & Coverage
How often do you need to collect data to monitor your AOI for your project? This is a common question not everyone thinks about. Frequency and coverage will influence your budget and relationship with your satellite imagery provider. Do you have a one-off image kind of project? Or a weekly monitoring project? Understanding your timelines and scope will help you decide on the right type of provider for your project.
Re-Visit Rates/ Temporal Resolution
Re-visit rates or temporal resolution vary from different providers. Temporal resolution provides information on the time difference between the acquisitions of two images over the same area. Above all, the higher the temporal resolution, the shorter the time difference between the image acquisitions. Each satellite has a maximum number of visits per day over an AOI. For example, you may want to task images daily in a particular area for a two-week period. If you decide you get a second image to compare different hours, this may be limited based on the provider you choose. Understanding revisit rates is a good question to ask in your discovery phase.
Date Range & Interval
The date range represents the days when you want the satellite to start and stop looking for data over your AOI. In EarthCache, an interval refers to the frequency of data collection over the requested date range. For example, if you set the interval to weekly and set your dates to include October, November, and December, EarthCache will try to return 1 result every week. However, if you change it to monthly, you’ll get a maximum of 3 results (1 each month).
Mosaicking
Sometimes, a single image collection won’t cover your AOI in its entirety. Mosaicking will try to find other images taken by the same satellite constellation, then check if any of them include the parts of your AOI missing in the original satellite image. The two images will combine side by side to cover your entire AOI.
Coverage
This allows you to set a threshold for the minimum percentage of usable pixels in the image. Certain locations are more prone to clouds; your satellite image isn’t guaranteed to be cloud-free. Thanks to SAR data, this becomes increasingly easier to achieve.
In conclusion, using EO data may be a new process for your company, but the value you’ll receive from these insights is invaluable. We’ve seen some amazing use cases from customers successfully adapting the processes to include satellite imagery to solve real-world problems. Read our Earth Day article to learn about the potential of satellite imagery. For more information or to talk to someone about your goals, contact us, and we’d be happy to guide you in your EO data journey.
