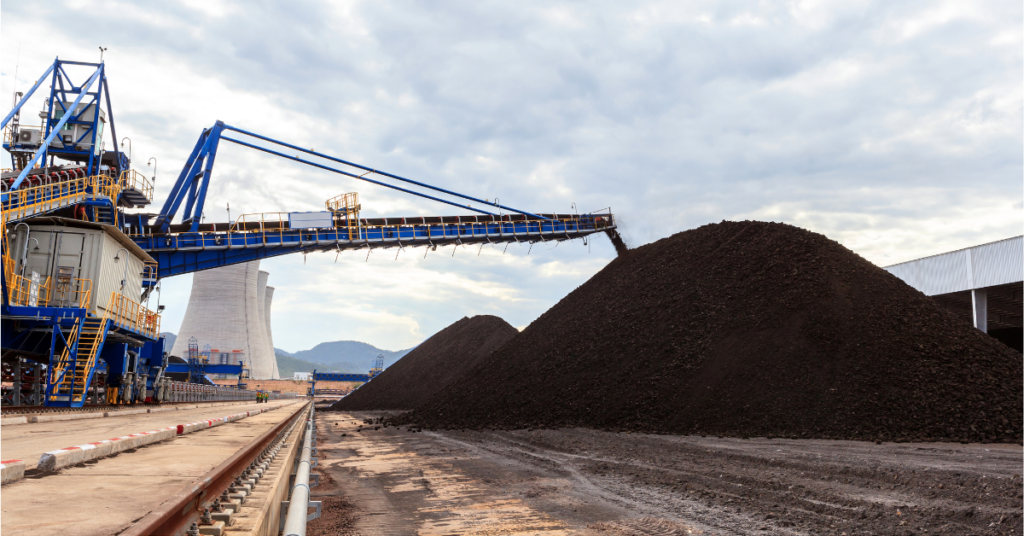
Stockpile volumes can be estimated from satellite imagery by reconstructing the three-dimensional shape of a pile and calculating the volume above the surrounding ground surface. Depending on the available imagery and required level of accuracy, this can be done using stereo imagery, shape-from-shading techniques, or geometric models based on the material’s angle of repose.
For mining companies, ports, bulk commodity traders, and industrial operators, satellite imagery provides a practical way to monitor inventory remotely and consistently, even at sites that are difficult or impossible to access.
Key takeaways
-
Satellite imagery enables remote monitoring of stockpile volumes at mines, ports, terminals, and storage facilities without requiring site access.
-
Common approaches include stereo photogrammetry, shape-from-shading, and angle-of-repose modelling.
-
Very-high-resolution optical imagery typically provides the best results.
-
Satellite-derived estimates are generally less accurate than drone surveys or ground-based LiDAR, but offer much greater geographic coverage and revisit frequency.
-
SkyWatch supplies the imagery needed for stockpile monitoring, while volumetric calculations are completed by the customer’s own software or analytics provider.
Why monitor stockpiles with satellites?
For many industries, stockpiles represent significant financial assets. Coal, iron ore, aggregate, grain, fertilizer, and other bulk materials are constantly being produced, transported, and consumed. Understanding how inventory changes over time supports production reporting, logistics planning, supply chain management, and independent verification of operations.
Traditional volume surveys rely on drones or ground survey crews. These methods can deliver excellent accuracy but require physical access, scheduled site visits, and favourable operating conditions. They are also impractical when monitoring third-party facilities or geographically dispersed operations.
Satellite imagery removes those constraints. A single platform can monitor stockpiles across multiple countries, revisit them regularly, and create a historical record of inventory changes without sending anyone into the field.
How is stockpile volume calculated?
A standard overhead satellite image only shows the footprint of a stockpile. To estimate volume, the height of the pile must also be determined. Several established techniques are used.
Stereo photogrammetry
Stereo imagery uses two or more images captured from different viewing angles to reconstruct the surface of a stockpile. Photogrammetric software generates a digital surface model that represents the pile in three dimensions, allowing its volume to be calculated relative to a reference ground surface.
This approach generally produces the most accurate satellite-derived volume estimates.
Shape-from-shading
Shape-from-shading estimates the geometry of a stockpile by analysing how sunlight illuminates its surface. Brightness variations and shadows reveal information about slope and elevation when the sun angle is known.
Although this method can work from a single image, it is generally less accurate than stereo reconstruction and is more sensitive to image quality and lighting conditions.
Angle-of-repose modelling
When only the footprint of a stockpile is available, software can estimate its three-dimensional shape using the material’s expected angle of repose. The resulting model provides an approximate volume that is often sufficient for inventory monitoring and trend analysis.
Once volume has been calculated, it can be converted into an estimated tonnage using the bulk density of the material.
What imagery produces the best results?
Image quality has a significant impact on volume estimation.
Very-high-resolution optical imagery, typically between 30 and 50 centimetres resolution, allows the edges and surface characteristics of stockpiles to be identified more accurately.
For stereo processing, suitable viewing geometry is essential so that elevation can be reconstructed reliably. Shape-from-shading techniques depend on well-defined shadows and a known sun angle. Frequent image acquisitions are also valuable because they allow operators to monitor changes in inventory over time rather than relying on occasional measurements.
Satellite-derived volumes are generally less precise than drone photogrammetry or ground survey, but they offer several advantages. Large numbers of sites can be monitored at a much lower operational cost, and remote or inaccessible facilities can be assessed without deploying survey teams.
Many organizations use satellite imagery for routine monitoring while reserving drone or ground surveys for periodic validation and reconciliation.
Typical workflow
A stockpile monitoring project typically begins by defining an area of interest and acquiring suitable imagery, either from historical archives or through new tasking requests.
The imagery is then processed using stereo reconstruction, shape-from-shading, or another volumetric technique to generate a three-dimensional model. After volume is calculated, material density can be applied to estimate tonnage. Repeating the process over time creates a historical record of inventory growth and depletion.
SkyWatch provides the imagery required for this workflow by bringing together very-high-resolution archive and tasked imagery from hundreds of commercial providers. The volumetric processing itself is completed by the customer’s own team or a specialized analytics partner.
How SkyWatch supports stockpile monitoring
With SkyWatch, it’s easy for mining companies, ports, logistics operators, and commodity traders to search and purchase high-resolution satellite imagery for specific locations and dates.
Our enterprise solution helps organizations manage imagery procurement and storage across multiple sites, while our API and ArcGIS integrations delivers imagery directly into custom analytics platforms, existing software workflows, and ArcGIS.
Because SkyWatch integrates imagery from hundreds of sources, users can select the combination of resolution, revisit frequency, and acquisition date that best matches their monitoring requirements.
If your organization monitors bulk materials across multiple locations, SkyWatch provides fast access to the imagery needed to support stockpile volume estimation and long-term inventory analysis.
Frequently Asked Questions
How accurate are satellite-based stockpile volume estimates?
Satellite-derived volumes are generally less accurate than drone photogrammetry or ground surveys, but they provide an effective solution for monitoring large numbers of sites or locations that cannot be accessed easily. Accuracy improves with higher-resolution imagery and stereo image acquisition.
What satellite imagery resolution works best?
Very-high-resolution optical imagery, typically around 30 to 50 centimetres resolution, provides the best results because it captures stockpile boundaries and surface detail more accurately.
Can satellites monitor stockpiles anywhere?
In most cases, yes. As long as suitable imagery is available and cloud cover does not prevent optical collection, satellites can monitor stockpiles almost anywhere in the world.
Does SkyWatch calculate stockpile volumes?
No. SkyWatch provides access to commercial satellite imagery. Volume estimation and three-dimensional modelling are performed using the customer’s own software or third-party analytics platforms.
Can stockpile changes be tracked over time?
Yes. Repeated satellite acquisitions make it possible to monitor inventory growth, depletion, production activity, and shipment cycles over weeks, months, or years.